
Summary
- Amazon and Microsoft lead the very lucrative cloud market, which generates substantial cash flows for investors.
- While they’re both titans of the cloud industry, one offers a more compelling value proposition. A winner is finally chosen based on both qualitative and quantitative factors.

Introduction
- The largest cloud stocks with the strongest, most predictable cash flows are not “pure plays”: the 3 most dominant cloud players (Amazon, Microsoft, and Alphabet), have lucrative cloud businesses embedded within their conglomerate business models. This leads to substantially diluted returns on these cloud plays, relative to the explosive growth of their respective cloud businesses.
- Here, an analytical framework is provided, by which we can determine where we should put capital to work.
Outline
- Valuing And Comparing AWS and Azure
- Valuation Comparisons
- Buy/Sell Recommendation
AWS Vs. Azure
- Market Share
- Revenue
- AWS valuation
- Azure valuation
Market Share
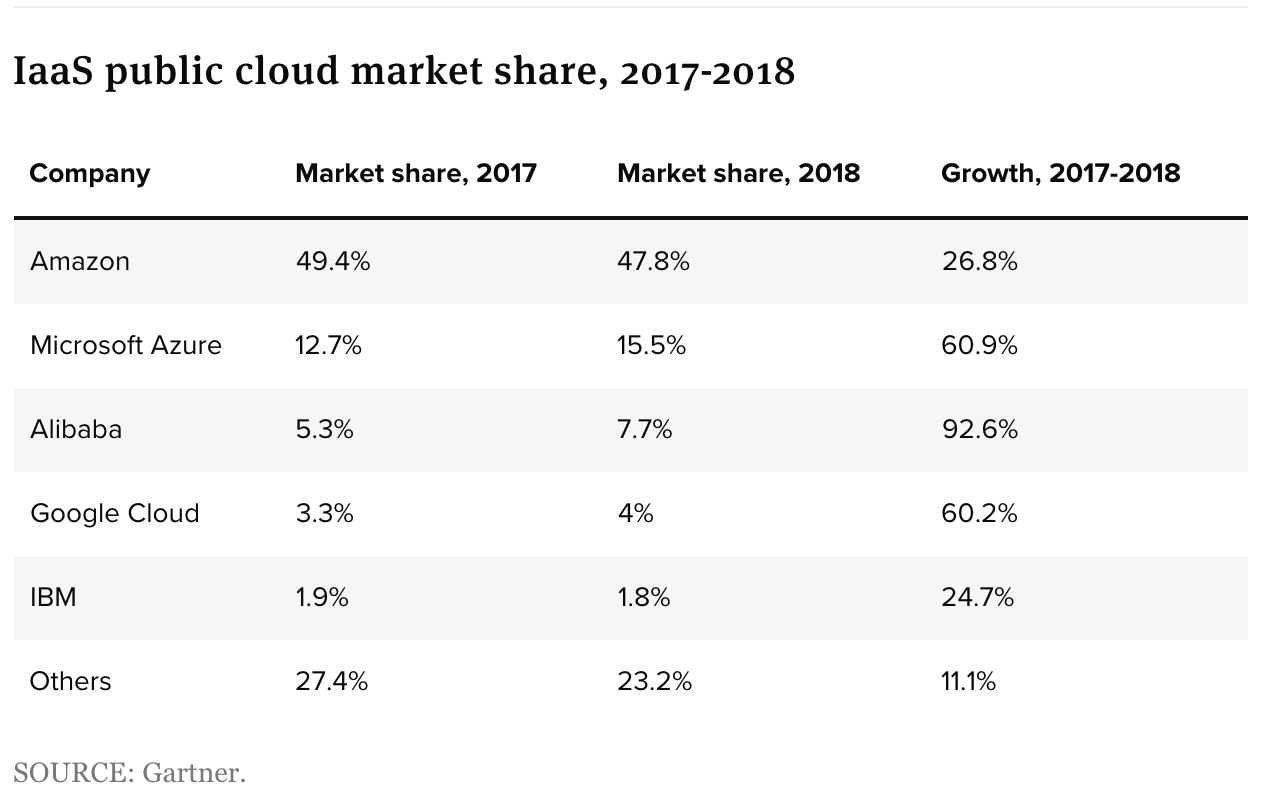
As can be seen above,
- Amazonhas retained their noteworthy grasp on leadership of the cloud computing market. However, their market share has actually begun to decline.
- Azurehas seen the greatest growth in market share.
Revenue Growth Rate And Margins
| Company | Revenue Growth Rate (YoY ’18-’19) | Operating Margin Growth Rate | Operating Margin |
| AWS | 37.6% | -19.14% | 26.34% |
| Azure | 59% | Unspecified expansion in margins | N/A |
Source: Amazon 10-Q (Quarter Ended Sept. 30, 19) & Microsoft 10-Q (Quarter Ended Sept. 30, 19)
During the 9 months ended Sept. 30, 2019,
- Despite Amazon‘s market share declining, its AWS revenues have actually continued to grow at a rate of 37.6% YoY.
- Azure‘s revenue grew at 59% while expanding its margins. Since a year ago, Azure’s quarterly growth is 76%, 76%, 73%, and 64%, respectively. This indicates Azure continues to grow at breakneck speeds, although this growth is slowing.
AWS Valuation
| Assumptions | Values |
| Project Average Cash Flow Growth Rate (10 yr) |
20% |
| Terminal Growth Rate | 2% |
| Discount Rate (90yr Annualized Return of SPY) |
9.8% |
| Initial Cash Flow Per Share | $16.036 |
| Fair Value | $779.96 |
Source: Amazon 10-Q (Quarter Ended Sept. 30, 19)
- This number as relatively conservative, as it places AWS at a valuation of around $400B, which is around 13x sales. With 37.6% growth currently, 13x sales for the most dominant cloud platform on earth seems reasonable.
- Further, at the end of 10 years, AWS will likely be more valuable than Amazon is today.
Azure Valuation
Unfortunately, Microsoft doesn’t break out Azure, as Amazon does with AWS, in their financial reporting. So, we are left only with their “Intelligent Cloud“. Interestingly, the Intelligent Cloud sports an operating margin of ~40%, which is significantly higher than Amazon’s AWS. As is Amazon’s M.O., this may be a byproduct of Amazon suppressing marginsin favor of growth.
| Assumptions | Values |
| Project Average Cash Flow Growth Rate (10 yr) | 20% |
| Terminal Growth Rate | 2% |
| Discount Rate (90yr Annualized Return of SPY) | 9.8% |
| Initial Cash Flow Per Share | $2.21 |
| Fair Value | $103.57 |
Source: Microsoft 10-Q (Quarter Ended Sept. 30, 19)
- As can be seen, Intelligent Cloud alone accounts for most of Microsoft’s present valuation. At $103.57 per share, the present fair value for the Intelligent cloud is $790B.
- Due to AWS’s margin compression, its valuation is 50% less according to a DCF model. So, while the Intelligent Cloud wins on the surface, the reality may be that AWS is either
- compressing their margins due to growth initiatives, or
- Microsoft’s margins will experience compression in the future.
The writer is inclined to believe the former, and therefore, AWS should be worth, as of today, closer to $1T than to 1/2 of $1T.
Valuation Comparisons
- Free cash flow generation
- Price to free cash flow
- Discounted cash flow models
- Sum of the parts analysis
Free Cash Flow Generation
- Presently, Microsoftgenerates a 50% higher CFC yield, but that is explained in the rate at which
- FCF has grown for the companies over the last 5 years, and
- it is projected to grow in the coming decade.
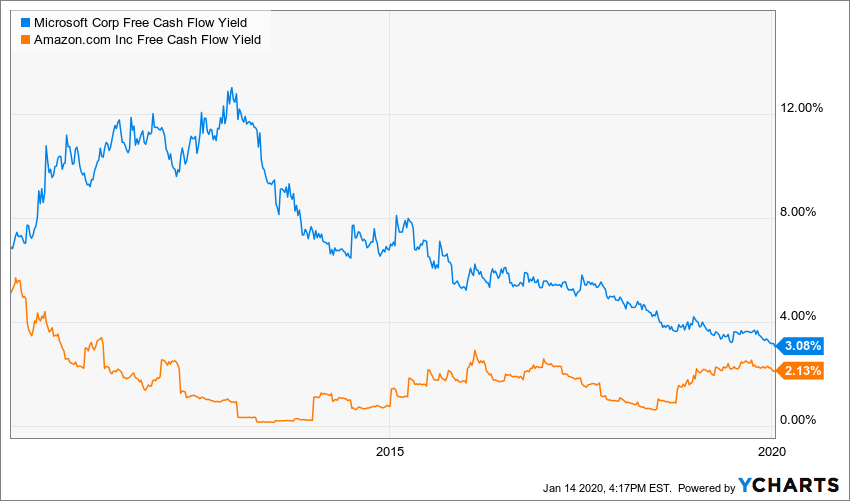
Source: YCharts.com
Price to Free Cash Flow
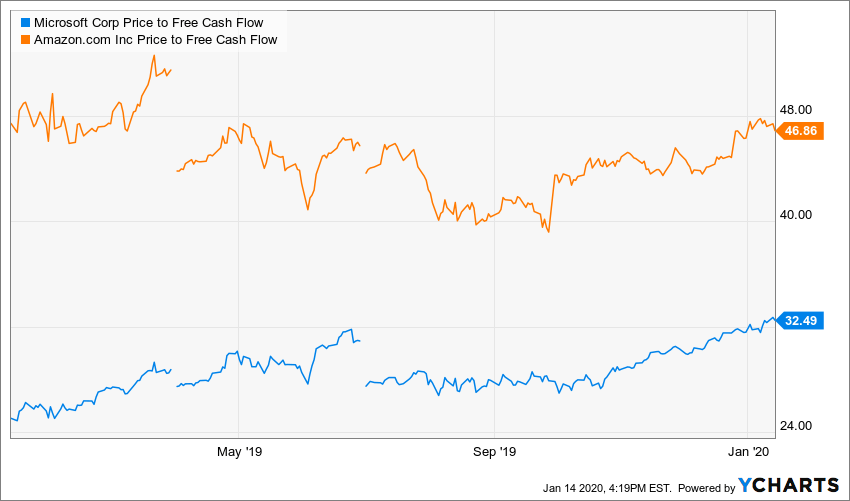
Source: YCharts.com
At present, Amazonis the technically more expensive buy, but as we will see in the discounted cash flow models, there’s a reason for this premium.
Discounted Cash Flow Model
Amazon
| Assumptions | Values |
| Total Sales Growth (2018 to 2019) | 20% |
| FCF Growth Rate (Past 4 years) | 28.35% |
| FCF Projected Growth Rate (10 years) | 25% |
| Terminal FCF Growth Rate | 2% |
| Discount Rate (90yr Annualized Return of SPY) | 9.8% |
| Initial FCF Per Share | 39.92 |
| Fair Value | $2780.48 |
Source: Data From YCharts.com
A few noteworthy assumptions:
- A 25% FCF growth rate for 10 years is certainly generous by anyone’s standards; however, the writer believes AWS will grow into the aforementioned nearly $1T valuation, thereby creating significant margin expansion for Amazon throughout the 2020s.
- Further, they have other means for margin expansion, such as
- their ads platform and subscription services, aand
- the yet recognized Alexa ecosystem, which will be monetized at some point throughout the 2020s.
- While sales will almost certainly slow to the mid-teens during the 2020s, margin expansion will continue as Amazon’s higher-margin businesses take flight in earnest.
With expanding margins and an eventual plan to return capital to shareholders, Amazon will have outpaced the market by 2030 from today’s price (around $1850).
Microsoft
| Assumptions | Values |
| Total Sales Growth (2018 to 2019) | 12.9% |
| FCF Growth Rate (Past 4 years) | 11.08% |
| FCF Projected Growth Rate (10 years) | 20% |
| Terminal FCF Growth Rate (%) | 2% |
| Discount Rate (90yr Annualized Return of SPY) | 9.8% |
| Initial FCF Per Share | 4.99 |
| Fair Value | $242.64 |
Source: Data From YCharts.com
- With Microsoft’s margins have been growing sizably a (with Q3 operating income at 27%, high margin businesses like LinkedIn and Azure at 25% and 59% respectively), we should continue to see robust FCF growth.
- Hence, despite revenues remaining steady in the mid-teens for Microsoft’s overall business, the writer went with 20% FCF growth for the next decade, and 2% thereafter.
Quick Note About Microsoft’s Capital Return Programs
- Microsoft has been relatively shareholder friendlyover the last decade via the execution of a decade worth of share buybacks and consistent dividend increases.
- In the last decade, Microsoft has executed share buybacks that have led to a 12.3% reduction in their total shares outstanding. Additionally, there seem to be no plans to halt this pattern of buying back shares, as Microsoft’s board of directors recently authorized another $40B worth of shares to be bought back in addition to the remaining $7B leftover from their previous $40B share repurchase program.
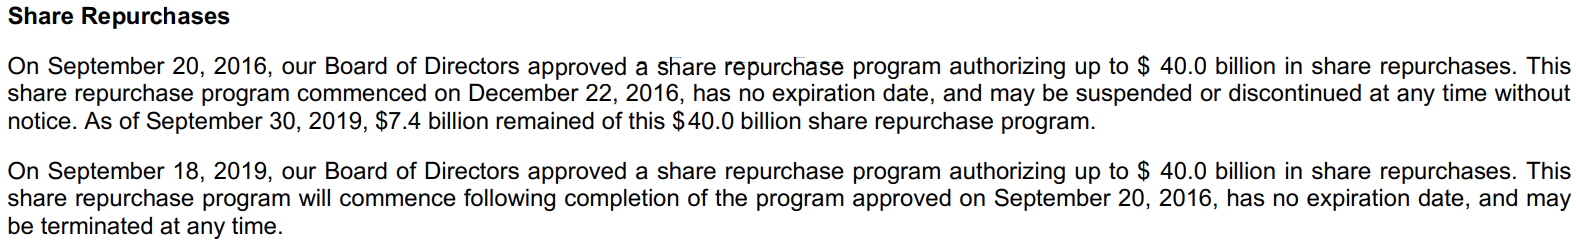
Source: Microsoft 10-Q (Quarter Ended Sept. 30, 19)
Implementing Margin of Safety
There are a couple ways to determine a margin of safety, we could arrive at our fair value by simply discounting the share price. We will choose a discount rate ~20% in excess of the above “assumed” discount rate (9.8%). Hence, with a margin of safety, we arrive at the below valuation for Microsoft and Amazon.
Azure
| Assumptions | Values |
| Total Sales Growth (2018 to 2019) | 12.9% |
| FCF Growth Rate (Past 4 years) | 11.08% |
| FCF Projected Growth Rate (10 years) | 20% |
| Terminal FCF Growth Rate | 2% |
| Discount Rate With Margin of Safety | 12% |
| Initial FCF Per Share | 4.99 |
| Fair Value | $175.84 |
| With Effects of Buyback (-13% of share count over 10 yr) | $202.00 |
Source: Data From YCharts.com
Of note, the FCF is projected at an average of 20% to account for the growth of high margin properties, such as Azure, LinkedIn, and subdued CAPEX growth.
At a discount of 12%, and when factoring in the effect of Microsoft’s share repurchase programs, a fair value lies somewhere in the realm of $202 as of today.
AWS
| Assumptions | Values |
| Total Sales Growth (2018 to 2019) | 20% |
| FCF Growth Rate (Past 4 years) | 28.35% |
| FCF Projected Growth Rate (10 years) | 25% |
| Terminal FCF Growth Rate | 2% |
| Discount Rate (90yr Annualized Return of SPY) | 12% |
| Initial FCF Per Share | 39.92 |
| Fair Value | $1,988.14 |
Source: Data From YCharts.com
Sum of the part analysis
As can be seen, the companies remain undervalued in light of the unrealized growth of their higher-margin businesses that will continue throughout the 2020s.
Buy/Sell Recommendation
AWS and Azure are poised to become $1T businesses over the next decade. However, capturing 37% and 59% growth rates will be tempered by the conglomeratesin which they are nested. Notwithstanding, both of these companies are rated a buy.
There won’t be a profound difference in an investor’s rate of return for either stock. Both companies’ betas will be closer to 1. With that being said, the writer would choose Amazon, despite their lower operating margins and higher present valuation; solely because we have not witnessed the extent to which Alexa will revolutionizeour lives. Moreover, the market is not properly valuing AWS as it will look in 2030.
Thank you, Stevens. L. for this analysis!
Content source: Stevens. L. (2020) Microsoft Vs. Amazon: Valuing The Cloud. Seeking Alpha. Available from: https://seekingalpha.com/article/4317612-microsoft-vs-amazon-valuing-cloud?fbclid=IwAR2Zd1cbPSV4aADf-49VjuIpfi_j7hXj839cQIXWS1jOz5ZYLYrNw7DEna8 [Accessed 20 January, 2020]
